What is Mitsucal ?
Mitsucal is a computer program designed to analyze short reads obtained from next-generation gequencing to identify mutations in various plant species.
Users are required to upload their short reads and to set several parameters for analysis.
Mitsucal was initially developed to analyze Arabidopsis thaliana mutants, and is now adapted for use with additional plant species.
Login
An e-mail address is required to log in to Mitsucal.
Please enter your e-mail address and "anonymous" as the password in the login form on the home page.
To analyze your own original data, please register your e-mail address according to the instruction in the next section.
When you are logged in, your e-mail address will be displayed at the top-right courner of the page. To log out, please click here.
Registration
Registration is only required if you want to analyze your own original data with Mitsucal.
Steps for registration
- Open the registration page by clicking the link on the home page or this link.
- Enter your e-mail address. Enter the letters and numbers for the CAPTCHA in the text box on the right. Click the "Registration" button.
- After your information is verified, a confirmation URL will be sent to the provided e-mail address.
- When registration is confirmed, a new password will be automatically generated. Please make note of your new password.
Forgotten password
If you forget your password, please open the page for Temporary password to obtain a temporary password. An e-mail will be sent to you with instructions on how to reset your password.
Start analysis
The following two steps are required to perform analysis with Mitsucal.
- Prepare computer resources for a new mutant
- Upload data (FASTQ files) and execute analysis
Steps to add mutant
- Log in to Mitsucal.
- Fill out the form for a new mutant on the home page.
- Specify the mutant name using the following characters: a-z, A-Z, 0-9, +, -, _, and #. Do not include any spaces.
- Select genetic background and backcrossed strains similar to your sample.
- Select marker selection method according to your experimental design.
- Input the Mitsucal 'Mutant ID' to be used as a control. If the ID is not known, please leave the box blank.
- After filling out the form, click the "Update" button and wait for a response from the site manager.
When your click the "Update" button, an e-mail will be sent to the site manager. The site manager will prepare the computer resources for storing your files. This will typically be completed in 24 hours, but may take a few days.
Steps for data upload
- Log in to Mitsucal.
- Click on the desired mutant in the list at the top of the page.
- Click the "Setup" tab.
- Drag your FASTQ files to the upload area. After uploading all data, check the analysis settings.
- Click the "Analyze" button in the "Anaylsis" tab. You will receive an e-mail when analysis is completed.
When you click the "Analyze" button, an e-mail will be sent to the site manager. The site manager assigns computer resources to analyze your files and starts the program. This will typically be completed in 24 hours, but may take a few days.
Results
To browse results, log in to Mitsucal.
After login, analyzed mutants appear at the top of the page. Please click on a Mutant ID to browse the results.
Sample results are shown below:
Screen shot of mutant page
Tabs at the top of the page are links to results. We recommend viewing the results using the tabs in the following order: Chromosome Mapping, Mutation List, and Gene Viewer .
Chromosome Mapping
Chromosome mapping is required to reduce the number of candidates for mutations. Images in this tab are helpful when the sequenced genomic libraries are prepared from segregants.
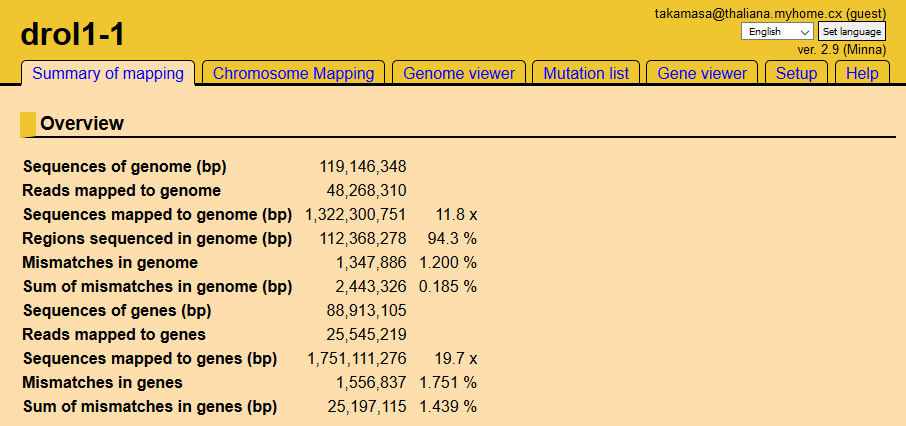
Mutant crossed to a different strain
A typical figure for chromosome mapping of a mutant that was crossed to a strain of a different genetic background is shown left. The vertical axis indicates the coordinates of the chromosome in mega base pairs (Mbp) and the horizontal axis indicates the base substitution rate at each position.
Display SNPs between 20.30 Mbp and 20.35 Mbp.
The table shows all observed mismatches between 20.30 and 20.35 Mbp. Coverage indicates the number of reads that include a given nucleotide. SNP count indicates the number of nucleotides different from the reference. The ratio of SNP count to coverage is expressed as a percentage.
In this region, the average SNP ratio was 82% (sum of ratios, divided by 97) and corresponds to the length of the horizontal line.
The SNP ratio was classified into four levels, and each level is shown as a different color (gray, olive, green, and purple). Twenty five SNPs with ratios of 90-100% are in this table, and 21% (82%×25/97) were marked as purple.
In this example, the region from 22-24 Mbp has the highest SNP ratio, which indicates that the gene of interest is located here.
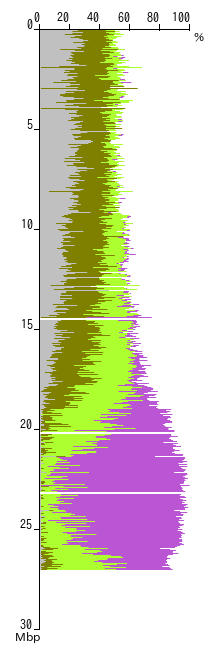
Mutant backcrossed to the parental strain
When a mutant is backcrossed to a parental strain with the same genetic background, fewer mismatches are observed. A typical figure for chromosome mapping in this case is shown left. Each horizontal line (wider than in previous image for emphasis) directly indicates the ratio of substitution.
In this example, the region around 10 Mbp has the highest SNP ratio, which indicates that the corresponding gene is located here.
After determining the locus harboring the corresponding gene, please navigate to the Mutation List tab. You may do this by dragging the locus.
Mutation List
After selecting loci by chromosome mapping, filter mismatches using the parameters below.
In a typical analysis, Mitsucal identifies hundreds of thousands of mismatches, including errors. You can narrow down the list of mismatches to find the desired mutation using the form. The table may be copied into a spreadsheet program if you would like to specify more precise filtering conditions.
Steps for filtering mismatches
- Range
- Select chromosome and input the region of chromosome with the corresponding mutation. This is a required fields.
- Mismatches, mismatch rate
- The range of mismatches and mismatch rate. If a homozygous mutation was expected, set the mismatch rate to 90-100%.
- QV rate
- QV represents quality value for sequence. QV are assigned to each nucleotide in a read and range from 0-40. If a homozygous mutation was expected, set the QV rate to 90-100%.
- Substitution in control
- If the control will not have a corresponding mutation, set to zero or a low value. If the control will have a corresponding mutation such as when the control library is originated from segregants displaying no phenotype, set to 1/3-1/2 of coverage.
- Limit to SNPs affecting translation
- Select this option to limit mutations that cause missense (amino acid substitution), nonsense (stop codon), and splicing defects (mismatches in 2bp end of intron).
- Limit to typical substitution pattern (G -> A)
- It is known that ethylmethane sulfonate (EMS) mutagenesis frequently cause G -> A substitution. Select this option to limit results to this type of mutation.
- Update table
- After completing the form, click the "Update table" button. It will take a few seconds or minutes for the changes to be reflected.
Mutation List
The Mutation List table shows all mutations corresponding to the specified conditions.
Clicking the gene number in the leftmost column will open a new Gene Viewer tab for that gene number.
- Gene
- Gene number containing mismatches. Clicking this link will open the Gene Viewer to show the aligned reads. Gene name (annotation) is in the rightmost column.
- bp
- The coordinates of nucleotides in the gene having mismatches. Please note that there are margins upstream and downstream of the gene.
- Reads:Sum
- Reads covering the nucleotide.
- Reads:Mismatch
- Mismatches at the nucleotide.
- Reads:Ratio
- Reads:Mismatch / Reads:Sum.
- QV:Sum
- Sum of QV (Quality Value) of nucleotides at the position.
- QV:Mismatch
- Sum of QV of mismatched nucleotides at the coordinate.
- QV:Ratio
- QV:Mismatch / QV:Sum.
- Control
- This column is displayed only when the control is set. Please note that only the same mutations observed in the control are shown. For example, when the sample has a G -> A mismatch and the control has G -> T mismatch, no mismatch is displayed.
- Control:Sum, Mismatch, Ratio
- Reads of control covering the nucleotide.
- Location
- Location of the mutation in the gene: OutOfGene, UTR, Intron, 3Intron, 5Intron, or coding is shown. 3Intron and 5Intron indicate that the mismatch is in the conserved 2bp at the end of an intron, which will cause a splicing error.
- Nucleotide substitution
- There is a mismatch between the reference sequence and the read, e.g. reference (G) -> read (A).
- Amino acid substitution
- When a mutation is in the translated region, the substituted amino acid is shown. If a mutation does not change the translation, "synonymous" is shown.
Gene Viewer
Gene Viewer visualizes the results of mapping and mutation. One example is displayed below.
Screen shot of Gene Viewer
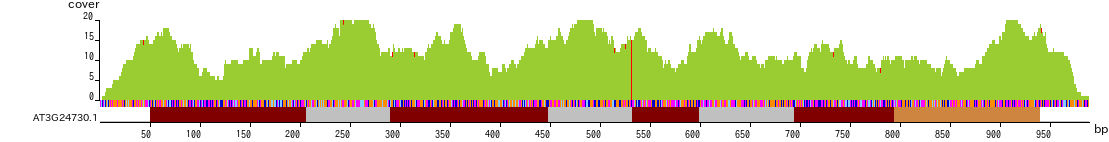
The horizontal axis indicates the nucleotide position in base pairs (bp). The brown, gray, and orange boxes indicate the coding sequence, intron and UTR, respectively. The multicolored bars represent nucleotide sequence, with A, T, C and G indicated by magenta, orange, cyan and blue, respectively.
The vertical axis shows the coverage of each nucleotide. The red lines indicate mismatches.
PCR primers can be designed by dragging the region of interest in the image,
Setup
- Name of mutant
- Enter your mutant name. This parameter does not have any effect on results. To reflect this change, please reload the page.
- Data type
- Select file format.
- Background strain of mutant
- Select the strain from which the mutant originates.
- Backcrossed strain
- Select the strain used to backcross.
- Marker selection
- Select chromosome markers (SNPs) for chromosome mapping.
-
Unique SNPs not in control (the mutant was backcrossed to parental strain)
- When a mutant originating from an Arabidopsis transgenic line is backcrossed to the parental line.
- When a mutant originating from the Oryza sativa Nipponbare strain is backcrossed to Nipponbare.
-
Shared SNPs with control (the mutant was crossed to a non-parental strain)
- When a mutant originating from an Arabidopsis Col strain is crossed to a Ler strain.
- When a mutant originating from the Oryza sativa Nipponbare strain is crossed to Kasalath.
- Mutagen
- Select the mutagen used to create the mutant.
-
EMS
Select this option when a DNA alkylating agent such as EMS, which typically causes G -> A substitution, was used.
-
Radiation
Select this option when mutants will have deletions and insertions in addition to base substitutions.
- Control
- Input the mutant ID to be used as a control.
- It is recommended to select, as a control, a mutant isolated from the same screening but having a different phenotype. When the non-mutagenized parental line is also sequenced, please input its mutant ID.
Search database
Some tools are provided to search the Mitsucal database.
BLAST
Search for a gene or chromosome in Mitsucal using BLAST.
Keyword search
You can do a simple keyword search for gene number and annotation.